Musa is a Brazilian technology company with a vision to revolutionize waste management. In this project, I was tasked with designing a new platform that would streamline the data collection process, replacing Musa's current spreadsheet system.
Process
Step 1. Understand
User surveys
User interviews
In-person observations
Alignment with engeneering
Step 2. Define
Research documentation
User journey maps
Problem statement
User needs and propositions
Step 3. Sketch
User flow
Wireframe
Tree map
Proof of concept
Step 4. Prototype
Prototyping
Benchmark testing
Define MVP scope
Hand-off
Step 5. Validate & Hand-off
A/B testing
User testing
Improved based on user feedback
Hand-off
Problem Statement
The problem statement for this project is: How might we develop a new data collection system that streamlines the process, improves accuracy, and standardizes data for the Musa operations team?
Current Scenario 🗺
The Musa operations team is facing challenges with data collection due to the high frequency of client visits. Visiting an average of 20 clients per day, the team is overwhelmed, leading to a lack of standardization and accuracy in data collection.
Why Face this Problem? 🤷
Team members spend an average of 1 hour per day inputting and managing data, resulting in a total of 20 hours per week spent on administrative tasks.
The lack of standardization and accuracy in the current spreadsheet system makes it challenging to identify trends and insights from the data, hampering the team's ability to make informed decisions.
Proposed Solutions
To address the problem, I proposed the following solutions:
Main Project 🏗️
Provide team members with better visualization of scheduled visits and directions from their preferred navigation app.
Create an intuitive and easy-to-use interface to input and visualize waste data for each establishment, reducing the time and effort needed to collect data.
Implement data validation to ensure data accuracy and standardization, enabling team members to identify trends and insights from the data more efficiently.
FILL-IN 📝
Provide live support to assist team members in resolving issues in real-time.
Research Methods
In-person observations 👀
I conducted in-person observation of the operations team's journey throughout the day. I observed ten team members, which accounted for 55% of the team, who were responsible for data collection and management.
Interviews 🎤
I conducted 5 one-on-one interviews with employees responsible for inventory management, to understand their daily tasks, challenges, and pain points.
The interviews lasted for approximately 45 minutes each and were conducted via video conferencing. I selected the interviewees based on their involvement in data collection and management and their experience working with the current spreadsheet system.
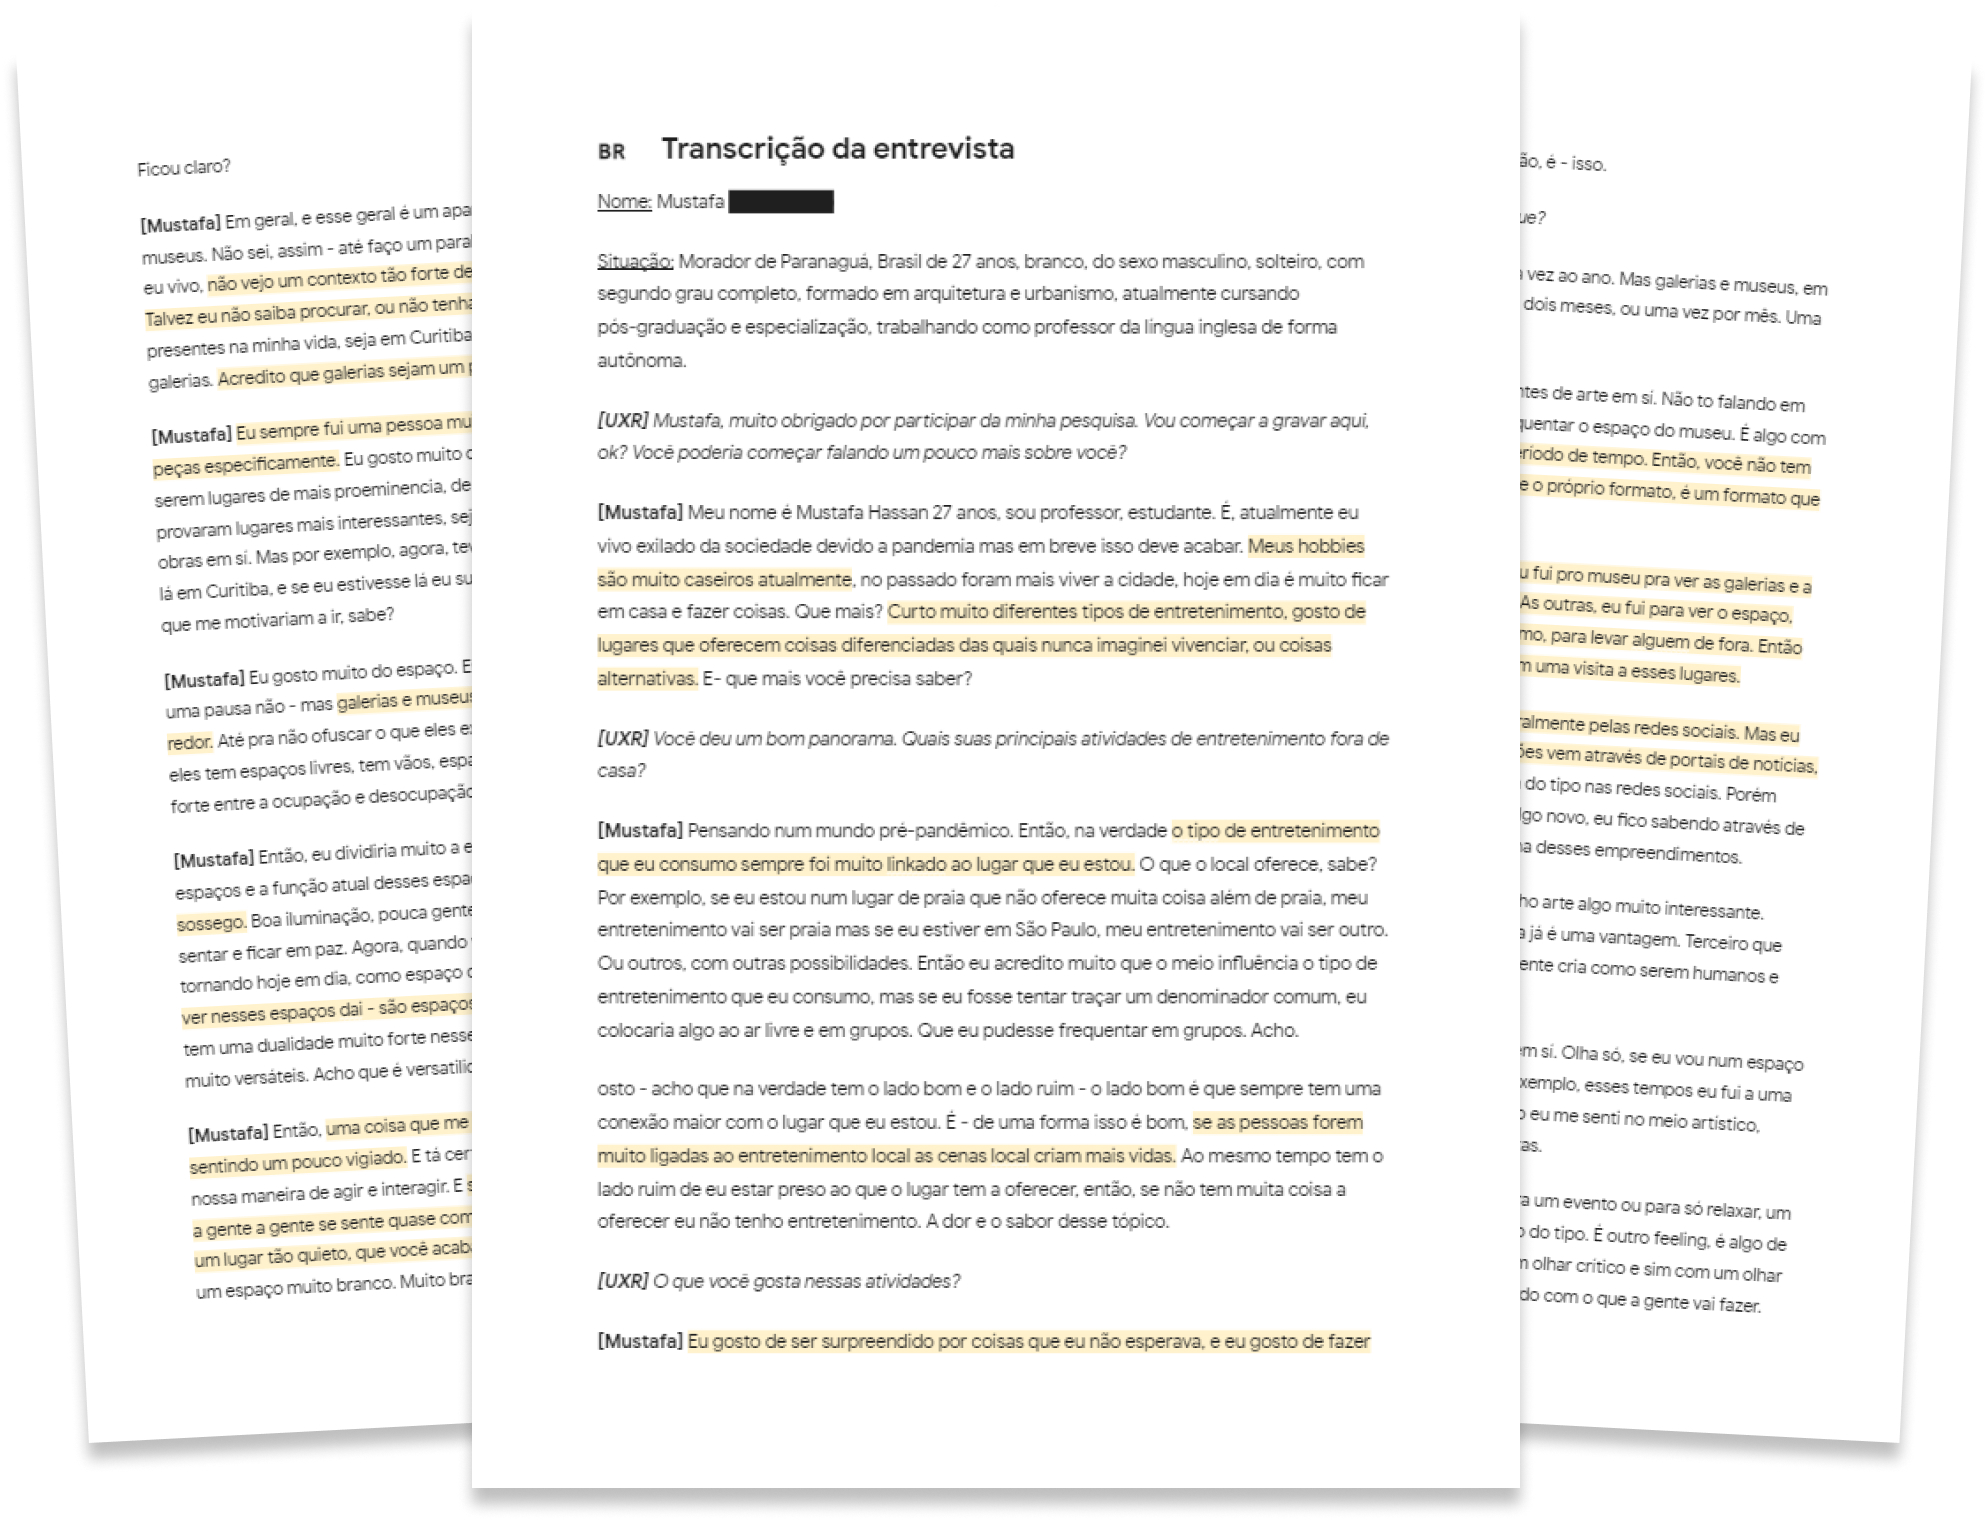
Interview transcripts from the one-on-one sessions.
Surveys 📈
I conducted an online survey among the operations team to gather feedback and identify common issues anonymously.
The survey was sent to all 18 members of the operations team, and 12 responses were collected. The survey consisted of 10 closed-ended questions and took an average of 5 minutes to complete.
Research Findings
In-person observations revealed that team members spent an average of 1 hour per day inputting and managing data, resulting in a total of 20 hours per week spent on administrative tasks. The team members also faced challenges with accuracy and standardization of data due to the current spreadsheet system's limitations.
The interviews revealed that the team members faced challenges with identifying trends and insights from the data, leading to difficulty in making informed decisions. The pain points identified were related to the accuracy and standardization of data, which impacted business outcomes, such as invoicing and billing.
The survey results showed that 80% of the operations team found the current spreadsheet system challenging to use, and 75% reported that it was time-consuming.
Design Tools
My approach to the Musa waste management project involved a variety of design tools and methods to arrive at the final solution.
MUSA'S Styleguide 🎨
The overall design had a guideline Musa's current design system developed previously by an outside agency.
Screens from Musa's current Customer app, which language should be leveraged in our final design.
User Journey Maps 🗺️
In-person observations were used to create user journey maps that identified opportunities for improvement and pain points.
These maps helped us understand the operations team's daily tasks and how our app could simplify their workflow.
By visualizing their journey, we were able to prioritize features and functionalities that would streamline the data collection process, improve accuracy, and standardize data.
User Journey Map created based on user observation
Problem Statements and Hypotheses 🤔
Based on the user journey maps, we defined pain points to create strong problem statements and formulated hypotheses on how to design solutions.
We brainstormed and ideated to ensure that the solutions we proposed would solve the pain points effectively.
We focused on creating solutions that were user-centered, easy to use, and efficient.
We prioritized solutions that streamlined the data collection process, improved accuracy, and standardization of data, such as quickly visualizing scheduled visits and live support.
User Needs and Propositions 🙋
To create a user-centered design, we identified user needs and propositions to understand what the product would do and why users should care.
We conducted user interviews to gather information on the operations team's needs and pain points. This information was then used to develop user personas that represented the target audience's characteristics, goals, and behaviors.
This helped us design solutions that met their needs and aligned with their goals.
Preliminary sketches created during Crazy 8s exercises where screens were brainstormed
Prototyping and User Testing
We used Figma to design the interface and create interactive prototypes. The prototypes were then tested through three rounds of remote usability testing sessions with five participants each.
The participants were selected based on their involvement in the current data collection system and their familiarity with technology. The testing sessions were conducted via video conferencing and lasted for approximately 30 minutes each.
Key Findings 📝
Remote usability testing revealed that the participants found the proposed solutions, such as quickly visualizing scheduled visits and live support, to be useful and effective in streamlining the data collection process.
The live support feature was not easily visible and accessible to the participants.
Some participants expressed dissatisfaction with the absence of compatibility for their chosen navigation software and the difficulty of obtaining directions for each visit.
Usability Tests and User Feedback
To ensure that the Musa waste management platform met the needs of its users, we conducted usability testing and collected user feedback at various stages of the design process.
The testing and feedback helped us identify pain points and areas for improvement, allowing us to iterate on the design until we arrived at the final solution.
A/B Testing 🔬
We conducted A/B testing to compare the effectiveness of different design solutions in improving the accuracy and standardization of data.
We created two versions of the app: one with intuitive interactions that guided the user through the data collection process and one without.
We then tested both versions with a group of 10 users, randomly assigning 5 users to each group.
The results showed that users who used the version with intuitive interactions were able to input data more accurately and consistently than those who used the version without.
Benchmark Testing 📊
To measure the performance of the new waste management platform, we conducted benchmark testing to compare it with the old spreadsheet system.
We recruited 5 users who were familiar with the old system and asked them to perform several tasks related to data collection and management on both systems.
The results showed that the new waste management platform was more efficient, with users completing the tasks 30% faster and more accurately than with the old spreadsheet system.
Changes Made Based on User Feedback 👂
Based on the feedback from our usability testing and benchmark testing, we made several changes to the Musa waste management platform, including:
Image of the first round of iterations based on feedback from usability tests.
Incorporating intuitive interactions that guide the user through the data collection process to improve accuracy and standardization of data.
Adding features that allow users to easily identify trends and insights from the data, improving their ability to make informed decisions.
Streamlining the user interface to improve efficiency and reduce the time spent on administrative tasks.
Providing live support with just two clicks to help users resolve any issues quickly and efficiently.
Conclusion
In conclusion, my user-centered contributions to the development of the mobile app helped Musa improve inventory management and achieve its goals.
The app allowed employees to easily track inventory needs and make informed decisions about restocking and ordering new products.
The app also reduced the time spent inputting data in about 30%, increasing accuracy and efficiency, according to our benchmark testing.
The research methods, including interviews, surveys, and remote usability testing, ensured the app was easy to use and understand. The use of A/B testing and benchmark testing helped identify areas for improvement, leading to a final product that improved efficiency and accuracy.
The app's impact on the operations team demonstrates the importance of user-centered design and the role of UX designers in creating impactful solutions.